SQL report task
A SQL Report task enables the easy creation of a responsive chart report from a list of SQL queries.
Report Composition
The report consists of an ordered list of charts placed from left to right with explicit (via the addition of a row break item) or implicit (depending on screen width) row breaks.
Each chart features a fixed height and a minimal width.
Upon task execution, every chart is dynamically populated with data sourced from a SQL query.
Task characteristics
In addition to the common task characteristics, here are those specific to SQL Report tasks.
Items
A list of chart definitions.
Title
Chart’s title.
SQL Query
The SQL query used to populate the chart.
The list and format of expected columns will depend on the type of chart to be displayed.
Character ‘:’ doubling
As the : character is used to identify project constants and task parameters to be injected into SQL queries, it should be doubled in other cases.
For example, the following postgresql query:
SELECT
  sales::integer as "Sales"
FROM ...
Should instead be written:
SELECT
  sales::::integer as "Sales"
FROM ...
Or even better:
SELECT
  cast(sales as integer) as "Sales"
FROM ...
Database name
The name of the database (chosen from the databases referenced in CTFreak) to connect to for executing the SQL query.
Base width
The minimal width of the chart (in pixels).
To respect this width, the chart will be preceded by an implicit row break if necessary, and completed by a horizontal scroll bar if that’s not enough.
Height
The fixed height of the chart (in pixels).
Chart type
Several types of charts can be used to represent the data returned by your query.
Bar chart & line chart
Expected SQL query format:
SELECT
  {dimension 1},
  {metric 1} ,
  {metric ...},
  {metric N}
FROM ...
- x-axis: {dimension 1} values.
- y-axis: {metric x} values with one colored line chart/bar chart per metric field.
Column number to start a 2nd axis from
When this optional field is filled in, a second y-axis (on the right) will be displayed and dedicated to the metrics starting from the {column number}-th column.
Example
SELECT
    DATE_TRUNC('day', date_order),
    SUM(amount_total) as "Sales ($)",
    SUM(previous_amount_total) as "Previous week Sales ($)"
FROM (
         SELECT
             date_order,
             0 as previous_amount_total,
             amount_total
         FROM sale_order
         WHERE date_order >= DATE_TRUNC('week', NOW()) - interval '1 week'
           AND date_order < DATE_TRUNC('week', NOW())
         UNION ALL
         SELECT
             date_order + interval '1 week',
             amount_total as previous_amount_total,
             0 as amount_total
         FROM sale_order
         WHERE date_order >= DATE_TRUNC('week', NOW()) - interval '2 weeks'
           AND date_order < DATE_TRUNC('week', NOW()) - interval '1 week'
     ) a
GROUP BY 1
ORDER BY 1
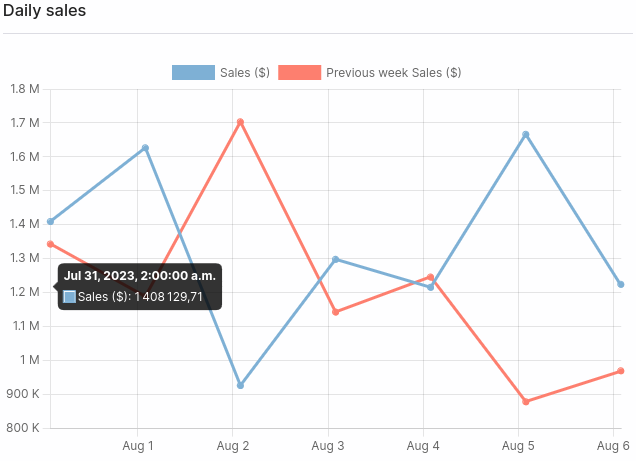
The data returned by this SQL query can be represented by either this bar chart:
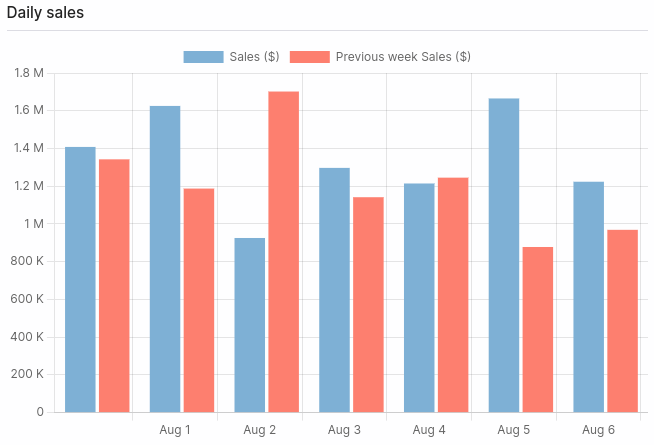
Or this line chart:
Horizontal bar chart & line chart
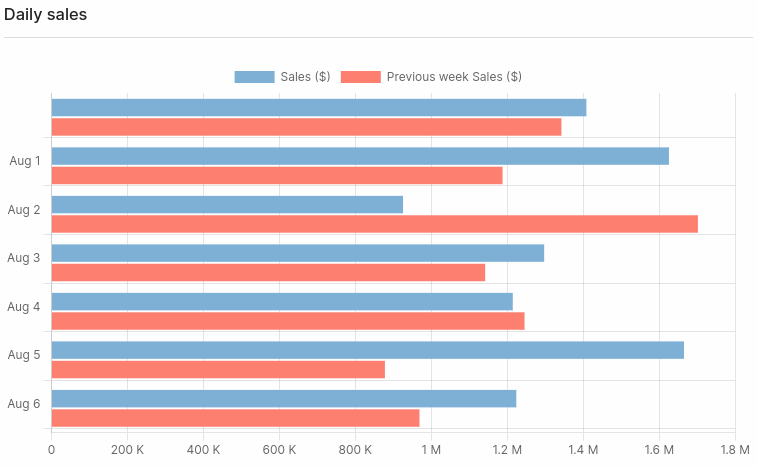
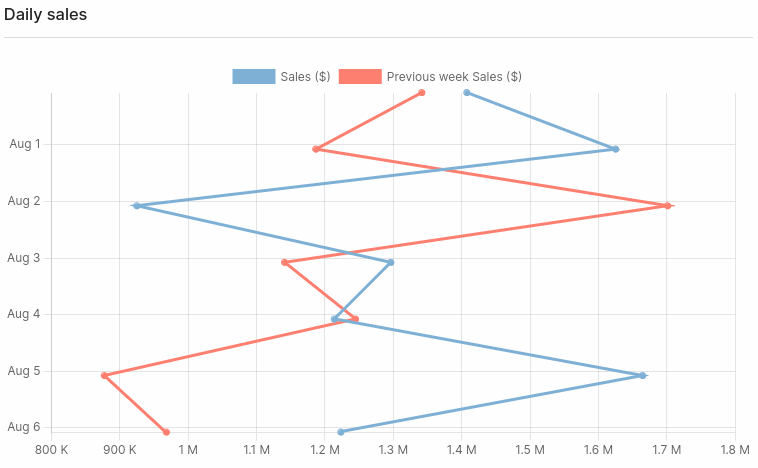
Same definition as bar chart and line chart, but with the X and Y axes reversed.
Example
If we use the previous query, the result for the horizontal bar chart is as follows:
And for the horizontal line chart:
Doughnut chart
Expected SQL query format:
SELECT
  {dimension 1},
  {metric 1} ,
  {metric ...},
  {metric N}
FROM ...
- One color per dimension value.
- One doughnut per metric field.
Example
SELECT
  TO_CHAR(DATE_TRUNC('day', date_order),'Day') as "Week Day",
  SUM(amount_total) as "Sales ($)",
  SUM(previous_amount_total) as "Previous week Sales ($)"
FROM (
  SELECT
    date_order,
    0 as previous_amount_total,
    amount_total
  FROM sale_order
  WHERE date_order >= DATE_TRUNC('week', NOW()) - interval '1 week'
  AND date_order < DATE_TRUNC('week', NOW())
  UNION ALL
  SELECT
    date_order + interval '1 week',
    amount_total as previous_amount_total,
    0 as amount_total
  FROM sale_order
  WHERE date_order >= DATE_TRUNC('week', NOW()) - interval '2 weeks'
  AND date_order < DATE_TRUNC('week', NOW()) - interval '1 week'
) a
GROUP BY DATE_TRUNC('day', date_order)
ORDER BY DATE_TRUNC('day', date_order)
The data returned by this SQL query can be represented by this doughnut chart:
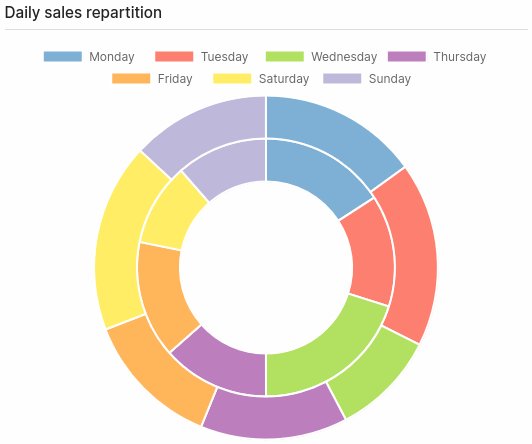
Table chart
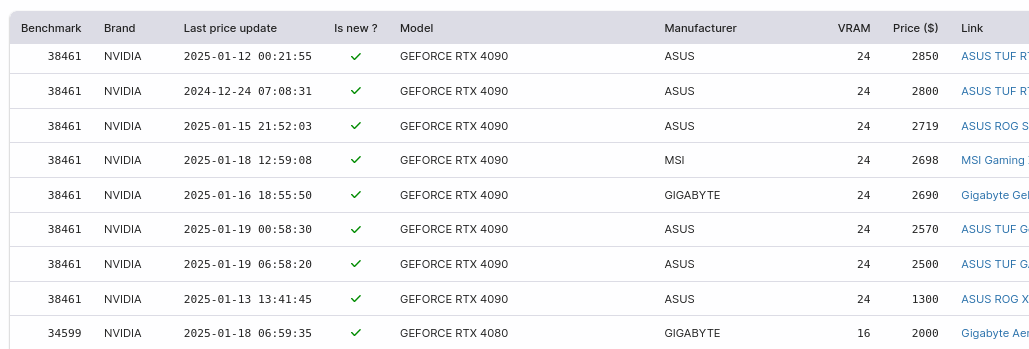
There is no specific SQL query format for table chart.
Markdown links are automatically detected and converted into html links when the table is displayed.
Where permitted by database drivers:
- Integer values will be right-aligned.
- Boolean values will be center-aligned.
- Date & timestamp values will be formatted as “YYYY-MM-DD HH:MM:SS”.
Example
select
  o.benchmark as "Benchmark",
  o.brand as "Brand",
  price_updated_at as "Last price update",
  condition='NEW' as "Is new ?",
  o.model_id as "Model",
  o.manufacturer as "Manufacturer",
  o.vram as "VRAM",
  o.price as "Price ($)",
  '['||o.name||']('||o.link||')' as "Link"
from gpu_offer o
order by o.benchmark desc, o.model_id, o.vram desc nulls last, price desc
The data returned by this SQL query can be represented by this table chart:
Column format
In SQL queries, it is possible to specify the expected format by adding a suffix to the column name.
List of possible suffixes for dimension-type columns:
_c_hour: The values assigned to this column will be considered as hours._c_day: The values assigned to this column will be considered as days._c_iweek: The values assigned to this column will be considered as weeks (starting on mondays)._c_week: The values assigned to this column will be considered as weeks (starting on sundays)._c_month: The values assigned to this column will be considered as months.
Using project constants
Project constants can be used in SQL queries as query parameter prefixed with :CPC_ (for CTFreak Project Constant).
Here’s an example using a project constant named MIN_REVIEWS:
SELECT
    "Popularity",
    count(*)
FROM (
  SELECT
    product_id,
    CASE
       WHEN count(*) >= :CPC_MIN_REVIEWS THEN 'High'
       ELSE 'Low'
    END as "Popularity"
  FROM reviews
  GROUP BY product_id
) a
GROUP BY "Popularity"
If you later decide to increase the minimum number of reviews of a product to consider it popular, you’ll only need to modify the constant value to affect all SQL queries referring to it.
Using task parameters
Like project constants, task parameters can be used in SQL queries as query parameter prefixed with :CTP_ (for CTFreak Task Parameter).
Here’s an example using a date task parameter named START_DATE:
SELECT
    DATE_TRUNC('day', date_order),
    SUM(amount_total) as "Sales ($)",
    SUM(previous_amount_total) as "Previous week Sales ($)"
FROM (
         SELECT
             date_order,
             0 as previous_amount_total,
             amount_total
         FROM sale_order
         WHERE date_order >= CAST(:CTP_START_DATE as date)
           AND date_order < DATE_TRUNC('week', NOW())
         UNION ALL
         SELECT
             date_order + interval '1 week',
             amount_total as previous_amount_total,
             0 as amount_total
         FROM sale_order
         WHERE date_order >= CAST(:CTP_START_DATE as date) - interval '1 week'
           AND date_order < DATE_TRUNC('week', NOW()) - interval '1 week'
     ) a
GROUP BY 1
ORDER BY 1
Task parameters values are converted according to parameter type into the appropriate SQL data type:
- Checkbox → BOOLEAN
- Date → TEXT (Formatting with the
YYYY-MM-DDpattern) - Selector → TEXT
- Integer → BIGINT
- Text → TEXT

